Visibility that
empowers growth

See more,
achieve more

Insight
that drives action

Clear view for
smarter decisions

Visibility

Direct access to dashboards and reports based on live data can provide businesses with better visibility into their operations and performance. When data is available in real-time, businesses can gain insights into key metrics and performance indicators that enable them to make informed decisions based on the most up-to-date information.

Dashboards and reports provide a visual representation of data, making it easier to identify trends, patterns, and anomalies in the data. This enables businesses to monitor performance, identify areas for improvement, and make informed decisions based on actual data rather than assumptions or incomplete information.

By having direct access to dashboards and reports, businesses can also respond more quickly to changes in the market, industry, or customer needs. For example, if a business notices a decline in sales for a particular product or service, it can quickly adjust its strategy to address the issue, rather than waiting until the end of the quarter or year to review the data and make changes.

In addition, direct access to live data can help businesses to identify potential risks and opportunities in real-time. By monitoring key metrics and performance indicators, businesses can identify emerging trends, such as shifts in customer preferences or market dynamics, and take proactive steps to address them.

Overall, direct access to dashboards and reports based on live data provides businesses with better visibility into their operations and performance, enabling them to make more informed decisions, respond more quickly to changes, and identify potential risks and opportunities.

Data Visualization

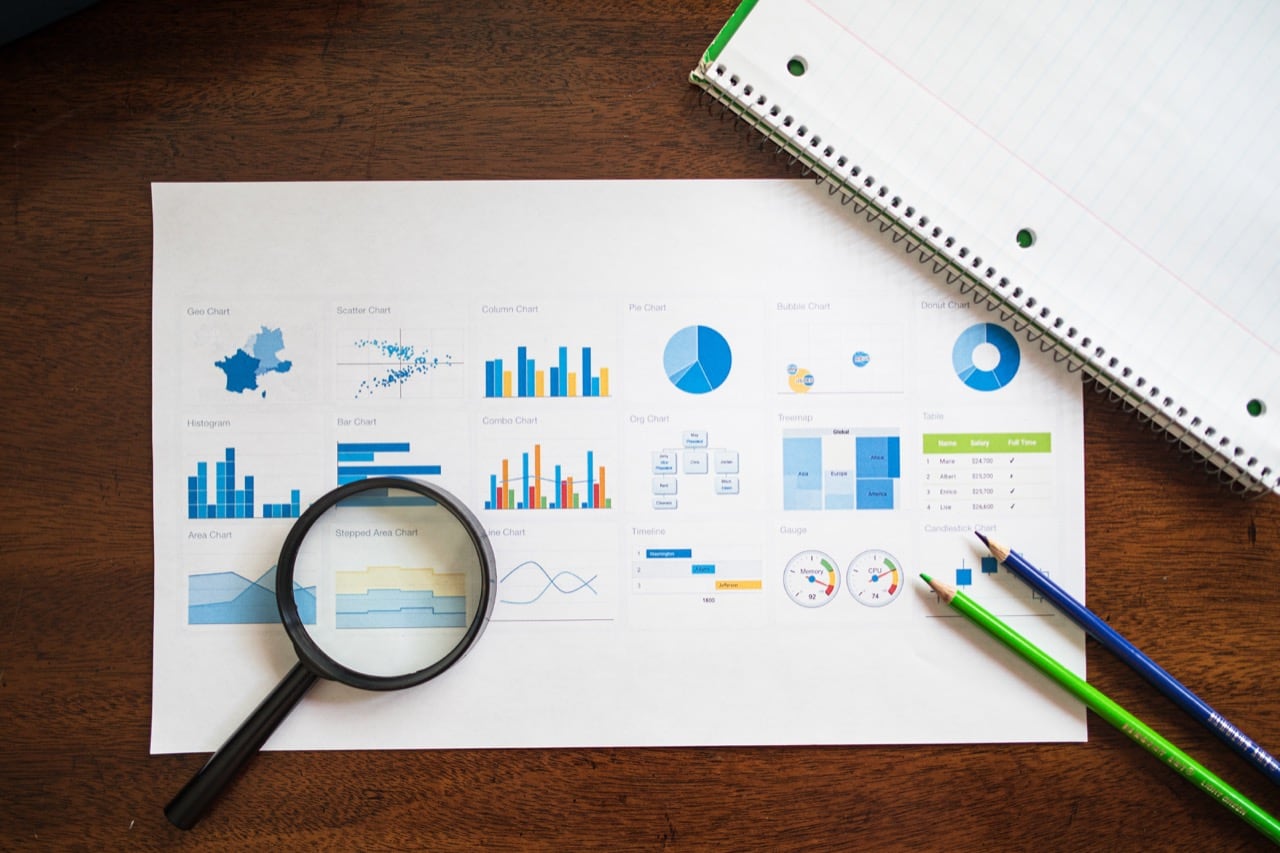
Being able to visualize data is and essential tool for businesses to make sense of the vast amounts of data they generate and collect. It enables organizations to represent complex data in a graphical or pictorial format, making it easier to understand and interpret.

By visualizing data, businesses can identify trends, relationships, and patterns that may not be immediately apparent in raw data, and use these insights to drive informed decision-making. Data visualization tools like Tableau, Zoho Analytics, and Google Data Studio have become increasingly popular in recent years, thanks to their ability to provide interactive, real-time visualizations that can be accessed and shared easily.

Comprehensive Reporting

Reporting is an essential component of any business, as it provides a means of tracking and measuring performance and progress. With the right reporting tools, businesses can generate custom reports that provide insights into key metrics, such as sales, revenue, and customer engagement.

This information can then be used to make informed decisions about the direction of the business, such as which areas to invest in, and which areas to cut back on. Reporting tools like Zoho Analytics and Salesforce are popular choices for businesses, as they provide the ability to create and customize reports quickly and easily.

By using reporting tools, businesses can gain a deeper understanding of their operations and make data-driven decisions that drive success.

Accessing Reports

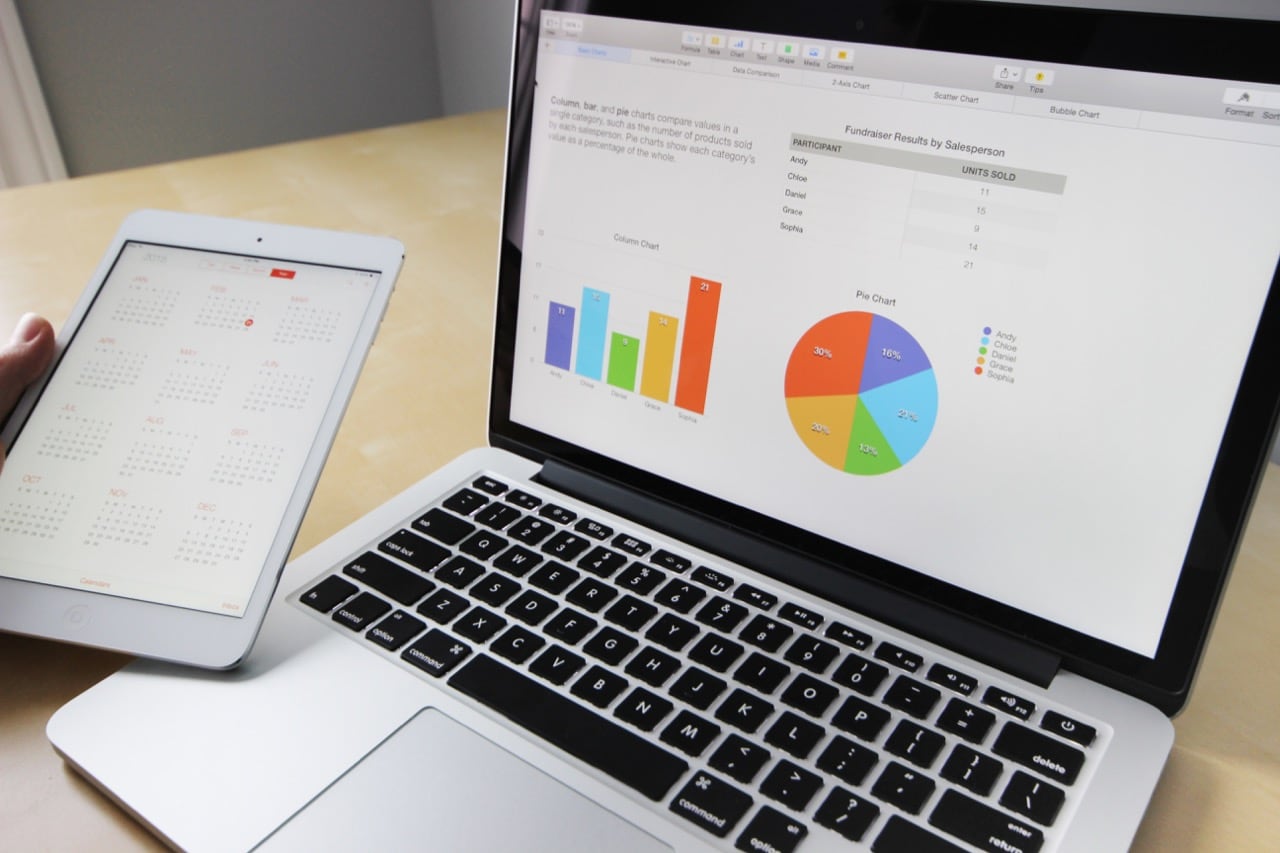
The ability to Access reports where and when you want them is essential for businesses to make informed decisions in real-time. Cloud-based reporting tools make it easy for businesses to access their reports from anywhere, at any time, using a range of devices. With cloud reporting, businesses can gain real-time insights into their operations and performance, allowing them to make timely and informed decisions.

The flexibility of cloud-based reporting tools also means that businesses can customize reports to their specific needs, with the ability to filter, sort, and visualize data in real-time. Overall, having access to reports where and when you want them is a critical component of a successful data-driven business strategy.

Holistic Reporting

At ClearScope Solutions, we understand the importance of having a comprehensive and accurate view of your business operations. That’s why our reporting tools enable you to gather and analyze data from multiple sources across various business units such as HR, Operations, Sales, and Finance.

By consolidating data from these different units into a single dashboard or report, you gain a holistic view of your business and can make informed decisions that can positively impact your company’s bottom line. With our reporting tools, you can easily access and share reports with your team, allowing for greater collaboration and more effective decision-making.

Why wait?

Choosing Clearscope Solutions as your partner for obtaining better visibility into your business performance is a wise decision. Clearscope Solutions is a leading provider of comprehensive business solutions that cater to the unique needs of businesses across different industries. By leveraging the latest cutting-edge technology, data analytics expertise, and unparalleled customer support, Clearscope Solutions is well-positioned to help your business achieve its goals.